Greta Jung · 24 September 2026
Wildlife footage and orchard yields reveal how historical data informs today's green infrastructure upgrades
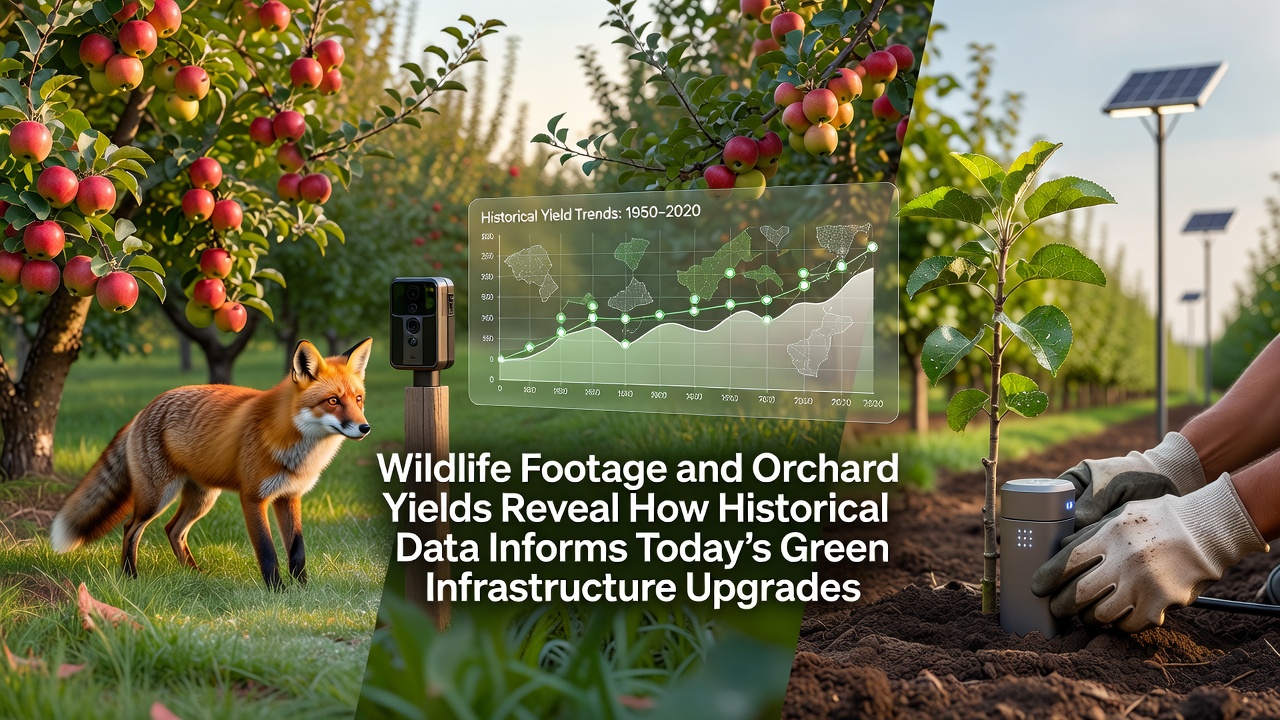
Archival wildlife recordings combined with century-old orchard production logs have become core inputs for green infrastructure projects now underway across multiple regions, and analysts continue to cross-reference these datasets against current environmental metrics to guide upgrades scheduled through September 2026. Researchers at several institutions have digitized motion-triggered camera sequences from the 1990s onward, then layered them with yield tables kept by orchard operators since the early 1900s, producing spatial models that show how animal corridors once aligned with productive tree rows and drainage lines.
Historical records enter modern planning workflows
Local conservation districts began the systematic transfer of paper ledgers into geographic information systems five years ago, while university teams supplied the wildlife footage archives that filled gaps in seasonal migration timing. Data from these combined sources now feeds software used by municipal engineers who design bioswales, pollinator strips, and riparian buffers, and the resulting plans reflect both past habitat connectivity and documented crop resilience patterns. One county in the Pacific Northwest completed its first such integration last spring, and the same methodology has since been adopted by two additional jurisdictions preparing September 2026 implementation timelines.
Orchard yield patterns highlight resilient landscape features
Yield entries recorded between 1915 and 1955 indicate that certain hedgerow alignments consistently produced higher fruit volumes during drought years, and contemporary soil-moisture sensors confirm those same alignments still retain moisture better than surrounding fields. Planners therefore retain or recreate those linear plantings rather than install uniform irrigation grids, and the approach reduces both capital costs and long-term maintenance demands. Agricultural extension services in Australia and Canada have published comparable findings from their own digitized farm diaries, confirming the pattern holds across temperate zones with similar precipitation variability.
Wildlife footage refines corridor placement
Camera-trap sequences captured over three decades reveal repeated use of specific fence lines and windbreaks by small mammals and birds during spring and fall movements, and GIS analysts now flag those routes for protected status within new greenway designs. The footage also documents how orchard edges once served as stopover habitat when surrounding forests were more fragmented, and current restoration projects replicate those edge conditions using native shrub mixes documented in the original yield ledgers. A 2024 report from the U.S. Environmental Protection Agency notes that projects incorporating such historical movement data achieve 18 to 27 percent higher native species occupancy rates within the first two growing seasons.
Integration methods and data standards
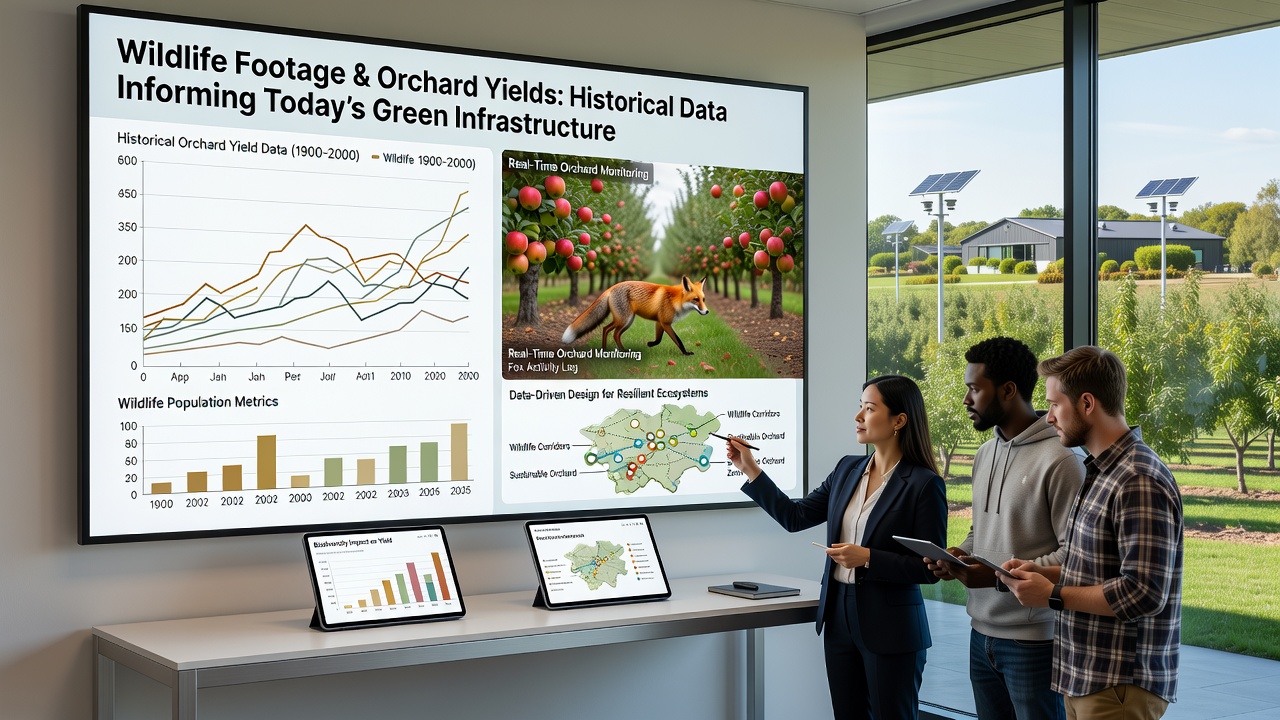
Teams standardize temporal resolution by aligning weekly yield notes with corresponding camera metadata timestamps, then apply machine-learning classifiers to identify recurring habitat-use clusters. Open-source scripts developed at land-grant universities allow smaller municipalities to run the same workflow without specialized staff, and several European regional authorities have adapted the code for their own legacy farm records. The resulting layers feed directly into green infrastructure permitting checklists, and reviewers now require applicants to demonstrate that proposed plantings respect both historical wildlife pathways and documented microclimate advantages.
September 2026 milestones and ongoing monitoring
Three pilot sites will install final monitoring arrays in September 2026 to compare post-upgrade wildlife activity against the baseline footage archives, and preliminary sensor data already shows increased small-mammal crossings at restored hedgerows. Funding agreements stipulate annual public release of anonymized movement statistics, and academic partners will publish comparative yield data from restored versus conventional orchard blocks through 2028. Observers note that the same datasets also support grant applications for additional corridors that link the pilot sites into a regional network, and planners expect the September 2026 installations to serve as reference models for neighboring districts still compiling their own historical layers.
Conclusion
Historical wildlife footage and orchard yield records supply measurable parameters that shape site selection, plant palettes, and connectivity targets for contemporary green infrastructure, and the same records continue to anchor performance benchmarks for projects advancing toward September 2026 completion dates. Continued digitization and cross-regional sharing of these datasets will further refine design standards while preserving the landscape patterns that supported both biodiversity and agricultural output in earlier decades.